The 59th annual Design Automation Conference (DAC) is this week. DAC is the premier event where design automation tool vendors gather to showcase their solutions. The event runs July 10-14 in San Francisco.
Yesterday at the show, Siemens EDA (formerly Mentor) unveiled a major new version of its mixed-signal verification software called Symphony Pro.
In this article, we will examine the problem Symphony Pro was designed to solve, dive into the product details, and share insights from our interview with Sumit Vishwakarma, principal product manager for Siemens EDA’s Mixed-Signal business unit.
Mixed-signal Chip Design on the Rise
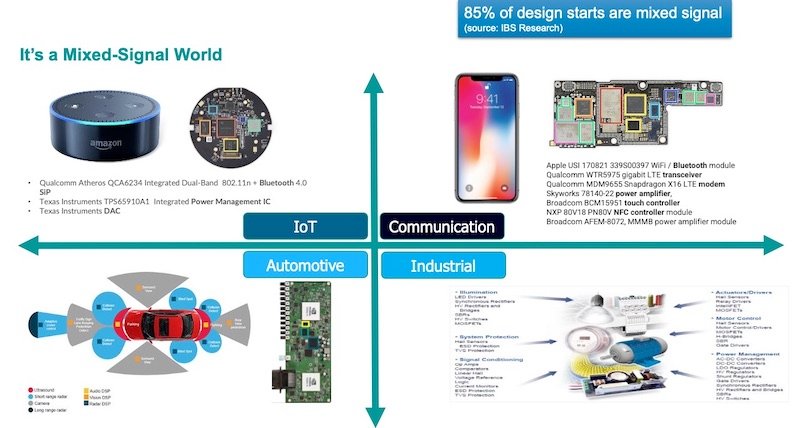
It’s clear that mixed-signal chips—ICs with both analog and digital circuitry—are becoming increasingly common. SoC and ASIC designers are increasingly finding the need for mixed-signal designs. Markets including IoT, communications, automotive, and industrial control contribute to this demand.
Across IoT, communications, automotive, and industrial control, engineers are doing more mixed-signal chips, with 85% of design starts being mixed signal according to IBS Research. (Click to enlarge)
According to Siemens, examples include blending analog signal chains with the digital-front ends (DFEs) in 5G massive-MIMO radios, crafting digital RF-sampling data converters in radar systems, and image sensors combining analog pixel read-out circuits with digital image signal processing.
Other examples include feeding the data appetites of data center computing by using advanced mixed-signal circuits to enable PAM4 signaling. Siemens cites data from market research firm IBS (International Business Strategies) that says that 85% of today’s design starts are mixed signal.
Challenges of Mixed-signal Verification
Mixed-signal IC design verification is a challenging task because the simulation needed for verification has to accommodate both analog simulation and digital simulation domains. The two domains are different in many ways, says Vishwakarma. Digital devices operate with discrete values, while analog circuits operate in the continuous domain.
Furthermore, digital deals with binary states of HIGH (1) or LOW (0), while analog circuits have node voltages and branch currents that can take positive or negative values arbitrarily, he says. And importantly, digital simulation can be done quickly—in minutes, but analog simulation is both slow and compute-intensive, requiring hours or even days to complete.

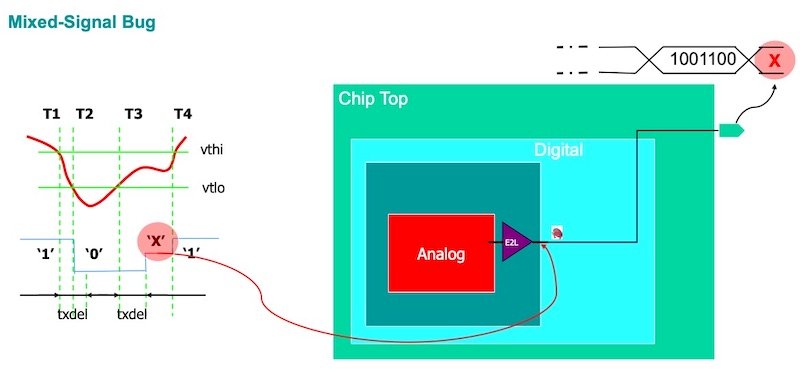
When an analog signal in a mixed-signal design doesn’t operate within discrete high/low thresholds, that data point “X” needs to be captured and made available at debug time.
Released in 2018, Siemens EDA’s previous mixed-signal verification tool, called Symphony, addressed many of those challenges by using a technique called Real Number Modeling to capture analog signal information using a digital approximation of the analog signals.
That allowed the simulation to take place as a 100% digital design flow and all the speed that entails. There are limitations to that in terms of accuracy. It assumes that conversions from analog to digital and back to analog are perfect, which is not the case. Vishwakarma points out that 90% of bugs in a mixed-signal design happen at the analog-to-digital boundaries.
With all that in mind, the new Symphony Pro tool adds methodologies to ensure all the important analog waveform data is collected for the simulation phase and is available for debugging.
Symphony Pro Visualizer Architecture and Flow
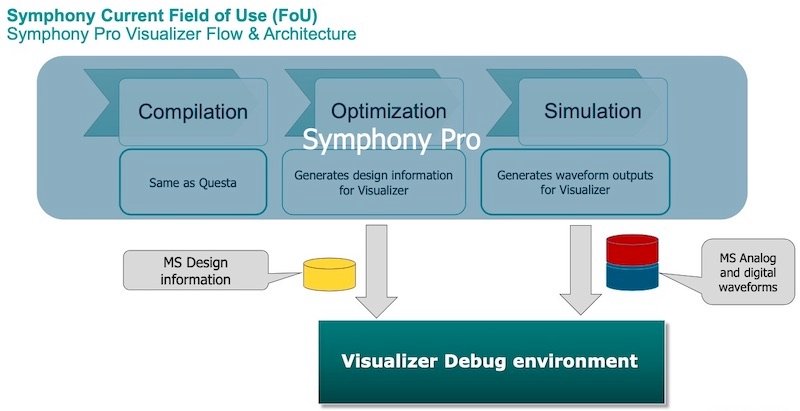
A key feature of Symphony Pro is its Visualizer Debug environment. Vishwakarma explains that there are three stages that make up the Visualizer’s flow. Just as any pure digital simulator would have (Siemen EDA’s Questa for example), first there is the compilation stage where you take a Verilog netlist and compile it. The second stage is optimization. That’s where the tool discards all the redundant data, keeping only the important design information for optimizing the design.

Symphony Pro creates an analog and mixed-signal database that includes all the analog and digital waveform data. This data is fed into the Visualizer MS Debug environment.
The third stage is simulation. It’s at the simulation stage that you apply the stimulus, run the simulation and generate waveforms, says Vishwakarma. At this point, Symphony Pro creates an analog and mixed-signal database. This database combines both the digital design information—Verilog and SystemVerilog for the digital blocks—as well as the analog design information with transistor-level data. The database also has all the analog waveform data.
According to Vishwakarma, Symphony Pro takes the two databases—the digital and the mixed-signal—and feeds them into Symphony Pro’s Visualizer Debug environment. Visualizer Debug is a digital debug tool that comes with Siemens EDA’s digital simulator tool Questa. But now, using the new analog and mixed-signal database info, the resulting data is visualized in a new tool that’s part of Symphony Pro called Visualizer MS (mixed signal).
Visualizer MS Provides Multi-faceted Debug Capabilities
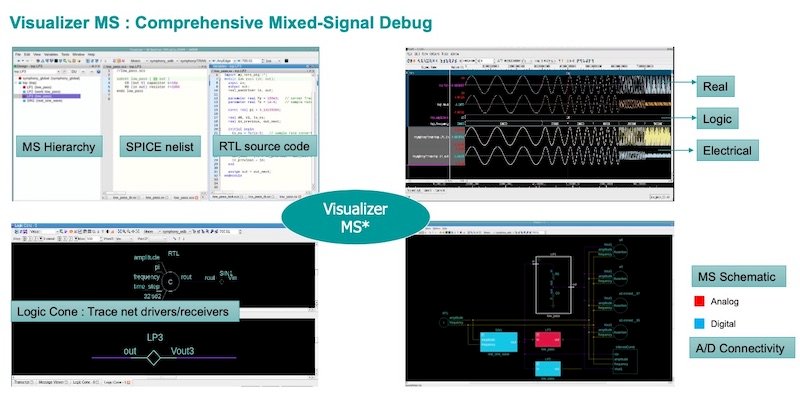
The Visualizer MS debug tool lets engineers build a mixed-signal hierarchy. As shown in the diagram below, users can analyze the design and debug using different windows. You can track mixed-signal hierarchies and look at SPICE netlists and RTL source code. You can just double-click on any of those to view the associated circuit or view the Verilog source code.
Several windows in Symphony Pro’s Visualizer MS debug tool are available to facilitate complex debugging tasks. Four are shown here. (Click to enlarge)
The Visualizer MS debug tool in Symphony Pro provides several windows that let engineers analyze the mixed-signal design from different points of view. These include:
- Design Window—lets you show the entire mixed-signal hierarchy, with color coding for different simulation languages.
- Source Window—lets you view the source code for design blocks in HDL languages and SPICE.
- Variables Window—shows Nets within a selected block with mixed-signal nets clearly delineated visually.
- Schematic Window—provides a connectivity view of the design with instance-based connectivity.
- Wave Window—shows waveforms including BEs (boundary elements) with back-annotation to the Schematic Window.
- Logic Cone Window—for driver/receiver tracing
- MSNet Window—provides a view of all mixed-signal nets and BEs inserted.
An important difference between Siemen EDA’s previous tool Symphony and Symphony Pro is that Symphony Pro can only be used with Siemens EDA simulators. In contrast, Symphony was compatible with simulators from other vendors.
A Long Journey and an Easier Road Ahead?
If there’s any consistent trend in semiconductors is that chips just keep getting increasingly highly integrated. Today, that means that analog and digital blocks living on the same IC are more common than ever. Tools like Symphony Pro are perhaps a sign that debugging and verification of these complex chips can be done with greater confidence and with greater ease.
All images used courtesy of Siemens EDA


